Until recently timing in EventIDE, e.g. event durations, was managed with variables of the integer type. It allowed to define a time in experiments with 1-ms precision. Now, with a enhancements in EventIDE clock engine and introduction of a new timing type, clTime, time intervals can be defined and measured with millisecond fractions. This may sound good in a theory but the question is, whether it does work in practice? The following tests are made to answer it.
Test 1. Timing accuracy of the non-visual events
When the EventIDE event does not contain a visual content, it’s automatically classified as a non-visual event. The onset and offset of the non-visual events can be controlled much easier because they don't cause screen updating. In the first test we measured accuracy of non-visual event durations over a multiple trial cases.
Methods
A standard PC computer (AMD IIX 6, 3.20Hz, 8GB RAM, ATI Radeon HD 48000) with Window 7 64 OS, was used (WEI -7.2). The measurement test was implemented as EventIDE experiment with a simplistic scenario. The test was run in the full-screen mode with a real-time priority of the EventIDE process. No other applications, except standard OS services were active in the system.
The test scenario run a loop of two interleaving non-visual events for 10000 times. The loop logic was created with two reciprocal time flow routes. The first event in a loop was testing event, whose actual duration was recorded after each offset. The second, ‘measuring’ event had fixed duration sufficient to execute the measurement code. Neither of tow events contained elements being functionally idle.
At start of each loop step, a requested duration for the test event was randomly chosen from the uniform range from 5 to 100 ms. The random values had the double precision, e.g. 35.678366666666ms. After offset of the test event, its actual duration was recorded by a high-performance system timer with resolution of 3.2E-4ms. Thus, two measurements, the requested and actual duration of the test event, were collected for 10000 times.
Results
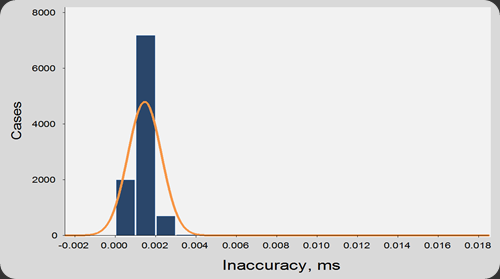
Signed differences between the requested and actual duration of each event, referred as inaccuracy or timing error, were taken for an analysis. The negative inaccuracy would indicate that an event has ended earlier than requested. The range between minimal and maximal inaccuracies shows EventIDE timing precision in this test, whereas the mean value indicates the timing accuracy. The plot and table below show the obtained results.
Statistics of timing inaccuracies:
| Mean (ms) | 0.001456 |
| Minimum (ms) | 0.0006 |
| Maximum (ms) | 0.0176 |
| Std.Deviation (ms) | 0.00083 |
| Standard Error (ms) | 0.000008 |
The results prove that EventIDE reliable ensures that the actual duration is never less than the requested duration. The mean of duration inaccuracy is as small as 0.001 ms. Over 10000 tests the actual duration exceeded the requested value by 0.01ms just in few cases. The standard error of timing inaccuracies is only 8 nanoseconds! Since the only idle and content-free EventIDE events were tested, the results tell about the timing precision and accuracy of the EventIDE core.
Test 2. Timing accuracy of the visual events without vertical synchronization
Despite of the excellent timing, the non-visual events have a limited application in real experiments. For example, sub-millisecond event durations can be used for making tiny changes in continuous communication signals. However, other aspects, such as stimulus presentation timing depend also on various software and hardware delays. Beside of the well-known onset latencies in computer monitors (Elze T. 2010) , there are also processing latencies in internal hardware components on a PC computer. To measure how timing in EventIDE is affected by this type of latencies, we measured an accuracy of event durations, when an event contains a visual content that has to be presented on the event onset and removed on the event offset. To avoid additional pauses caused by synchronization with monitor’s cycles, the vertical synchronising was turned off.
Methods
The testing procedure was the same as before except that the testing event contained a visual stimulus- a central white dot. Due to that fact a attached visual surface, 1024x768 , was automatically created for the test event. EventIDE copied the event surface in the front buffer on each event onset and erased it on the event offset.
Results
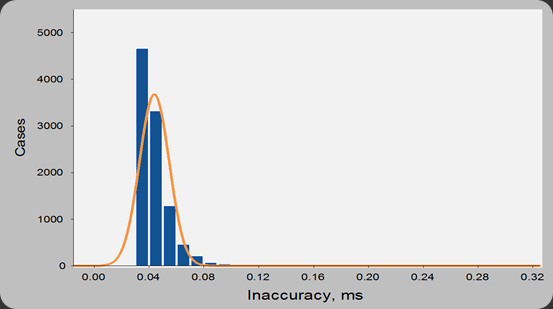
Signed differences between the requested and actual duration of each event, referred as inaccuracy or timing error, were taken for an analysis. The negative inaccuracy would indicate that an event has ended earlier than requested. The range between minimal and maximal inaccuracies shows EventIDE timing precision in this test, whereas the mean value indicates the timing accuracy. The plot and table below show the obtained results.
Statistics of timing inaccuracies:
| Mean (ms) | 0.043852 |
| Minimum (ms) | 0.0279 |
| Maximum (ms) | 0.3166 |
| Std.Deviation (ms) | 0.010832 |
| Standard Error (ms) | 0.000108 |
The results prove that EventIDE ensures that actual duration of the visual events is never less than the requested duration. The mean of duration inaccuracy is as greater than for the non-visual event but still as small as 0.028 ms. Over 10000 observations the actual duration did not exceed the requested value more than 0.1 millisecond (99% of all cases). The standard error of timing inaccuracies is only 108 nanosecond!
The results demonstrate timing precision and accuracy in EventIDE under a realistic load. Both, the processing delays of the EventIDE core and latencies of PC software/hardware components contributed to the measured timing inaccuracies, which are still very small.
Test 3. Timing accuracy of the visual events with vertical synchronization
In real experiments onsets of visual stimuli are usually synchronized with monitor’s refresh cycles- it allows to control stimulus presentation in the predictable way. This brings an additional source for timing inaccuracies caused by desynchronization between the computer and monitor’s clocks. In order to measure the timing precision and accuracy in EventIDE with all error sources combined, we conducted the following test.
Methods
The testing procedure was the same as in the previous test for the visual events, except that the onset and offset of the testing event was synchronized with a start of monitor’s refresh cycle. Another difference was that the requested duration of the test event was aligned with the monitor’s frame rate : a random number of monitors frames (from 1 to 7) was multiplied on the duration of a single frame in the system, 13.3(3)ms.
Results
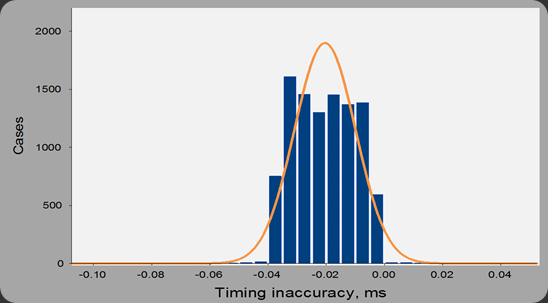
The differences between the requested and actual duration of each event, referred as inaccuracy or timing error, were taken for an analysis. The range between minimal and maximal inaccuracies shows EventIDE timing precision in this test, whereas the mean value indicates the timing accuracy. The plot and table below show the obtained results.
Statistics of timing inaccuracies:
| Mean (ms) | -0.020421 |
| Minimum (ms) | -0.0887 |
| Maximum (ms) | 0.0485 |
| Std.Deviation (ms) | 0.010506 |
| Standard Error (ms) | 0.000105 |
The results show that EventIDE can ensure the absence of dropped frames over a long run intervals, because otherwise the maximal inaccuracy would be greater than 13.3ms- duration of a single frame in our system. In this test negative inaccuracies are observed due to the desynchronization between monitor’s and EventIDE clocks (which can be expected). The mean of duration inaccuracy is -0.02ms, whereas the standard deviation is 0.01 ms, which are excellent results. The standard error of timing inaccuracies is only 105 nanosecond!
Conclusion
The results of all three tests confirmed a reliable sub-millisecond timing accuracy and precision in EventIDE over long run intervals
- The worst mean deference between the actual and requested time durations was always less than 0.05 milliseconds
- The excellent timing consistency, or precision, is proved by the low SD and SE values - 0.01 and 0.0001ms, correspondingly


